Exercise - Simulate Ad Hoc Network
General
The objective of this assignment is to get familiar with the network simulator tool (ns-2) and mobile wireless network environment. This study about ad hoc wireless network will be carried out by simulations using the ns-2 tool.
These simulations will be run using Sun workstations of the Birdland (Lintula). The results of the work will be reported in writing.
In this document there are first some are conceptual definitions, instructions for simulations, reporting, grading and returning the report. In the end of this document there are some facts related to implementation details and tips for those who find the required scripting problematic.
Using ns-2
"Ns is a discrete event simulator targeted at networking research. Ns provides
substantial support for simulation of TCP, routing, and multicast protocols over wired and wireless (local and satellite) networks." (http://www.isi.edu/nsnam/ns, 18.6.2004) ns-2 is an interpreter of OTcl language, which includes objects for simulating networks. Those objects are implemented using C++, but OTcl is an interface that can be used for calling methods of the objects.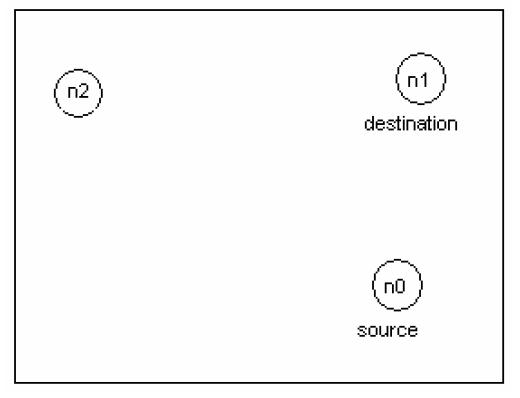
The network topology, transmission and application agents
In the picture every circle represents a wireless mobile node. The network consists of TCP source node (n0) and destination node (n1) over an area size of 500m x 500m. Node (n0)uses Agent/TCP/Reno as the sending TCP agent and FTP traffic source. Node (n1) is the receivers of FTP transfers, and it uses Agent/TCPSink as its TCP-agent for the connection establishment.
The routing protocol used for the simulation scenario is ad hoc routing protocol Destination Sequenced Distance Vector (DSDV) and IEEE 802.11 MAC protocol. The targets of the simulation.
In this simulation you will study, the three different wireless network scenario;
The ns-2 script file 2node_script.tcl (http://www.cs.tut.fi/kurssit/TLT-2756/assign.html) for this wireless network is provided. This creates the topology described earlier, runs the simulation for 150 seconds and shows the TCP window size in two static nodes scenario with DSDV routing protocol. Run the script and analyze the output graph for the given scenario.
Use the given script file and change the state of the node (n1) from static to mobile for this second scenario. At time 10 s, node (n1) starts moving towards the point (45, 285) at a speed 5 m/s. The syntax of movement command;
$ns at
![]()

No comments:
Post a Comment