GT-ITM : Network Topology Generator
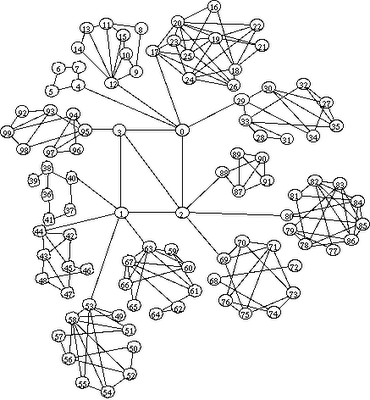
A topology generator creates a graph representation of a network based on a model and a set of parameters specified by the user. These representations are often used as input to a simulation; if the graph approximates characteristics of a real network, then the simulation results predict the behavior of a network protocol or application if it were to be deployed.
Most simulations from literature in the field have used representations of a real topology (e.g. the Arpanet or a well-known provider's backbone), simple models (e.g. a ring or a star), or randomly-generated flat topologies using a variation of Waxman's edge-probability function. Recently, more complex randomly-generated hierarchical models have been used to better approximate the Internet's hierarchical structure.
Models
1. Flat Random
Methodology: Randomly place nodes at locations in a plane, then connect nodes with edges according to the probability given by the edge mode.
Parameters: Number of nodes, scale, edge method, alpha, beta, gamma. See a comment from the code for an explanation of how each method uses alpha, beta, and gamma.
Example:
# 10 nodes, 10x10 grid, pure random, 0.2 edge probability
10 10 1 0.2
2. N-Level Hierarchical
Methodology: Start with the top level and create a flat random graph. Recursively replace each node in current level with a connected flat random graph. Resolve edges between levels by selecting nodes at random from within the replacement graph.
Parameters: Number of levels, For each level, a set of parameters describing the graph.
Example:
# 3 levels, each with 10 nodes, Waxman 1, alpha and beta as shown
3
10 10 1 0.7 0.2
10 10 1 0.5 0.2
10 10 1 0.4 0.2
3. Transit-Stub Hierarchical
Methodology: Create a 2-level hierarchy, with each top-level node representing a transit domain, and with the second level giving each intra-domain graph. Next, attach stub domains to each transit domain. Finally add extra transit-stub and stub-stub edges.
Parameters: Number of stubs per transit, Number of transit-stub edges, Number of stub-stub edges, Top-level, transit-domain, and stub domain parameters.
Example:
# 3 stub domains per transit, no extra transit-stub or stub-stub edges
# 1 transit domain, fully connected
# transit domains have average of four nodes, edge prob 0.6
# stub domains have average of 8 nodes, edge prob 0.4
3 0 0
1 10 3 1.0
4 20 3 0.6
8 10 3 0.4
Generating graphs from GT-ITM topology generator.
Download the GT-ITM Topology Generator software.
The GT-ITM topology generator can be used to create flat random graphs and two types of hierarchical graphs, the N-level and transit-stub. Take a look at the examples in Daniel Zappala's homepage. Also look at the documents under docs subdirectory of GT-ITM's distribution.
For example, we need to create a transit-stub graph with 200 nodes. So we create a specification file, say ts200, that goes like this:
## Comments :
## <#method keyword> <#number of graphs> [<#initial seed>]
## <#stubs/xit> <#t-s edges> <#s-s edges>
## <#n> <#scale> <#edgemethod> <#alpha> [<#beta>] [<#gamma>]
## number of nodes = 1*8* (1 + 4*6) = 200
ts 10 47
4 0 0
1 20 3 1.0
8 20 3 0.8
6 10 3 0.5
On running 'itm ts200', 10 transit-stub graphs with 200 nodes each will be created starting with initial seed 47. line 4 0 0 means each transit node will have 4 stub domains connected to it;there shall be no extra transit-stub edges and no extra stub-stub edges. Line 1 20 3 1.0 means there will 1 transit domain in each graph. Line 8 20 3 0.8 says each transit domain will have, on an average, 8 transit nodes with an edge between each pair of node with a probability of 0.8 and line 6 10 3 0.42 says every stub domain shall have, on an average, 6 nodes each with an edge between every pair with a probability of 0.5.
For a more complete description of the parameter specification file see models.ps file under docs subdirectory.
The graphs produced are named as ts200-[0 to 9].gb and are in Stanford Graph Base Output format. This needs to be converted to tcl format for ns-2 to interpret it correctly.
Conversion of GT-ITM output to ns-2 format
Download the sgb2ns conversion program. Follow instructions in the README file and create the sgb2ns executible. Note that sgb2ns should be expanded in the gt-itm directory, and its executibles will be placed in gt-itm/bin subdirectory. This distribution also contains ts2ns and sgb2hier as described below.
Modify sgb2ns's Makefile to make macro GT_ITM to point to the right path and correct Stanford Graphics Base library name installed in your system(e.g libgd.a, libgb4.a or libgb5.a etc). The library also comes as a part of gt-itm distribution. Under any circumstance it should reside under gt-itm/lib.
sgb2ns converts the sgb output to tcl output.
Usage : sgb2ns ts200-0.gb ts200.tcl
A modification to sgb2ns contributed by Yunxi Shi separates transit nodes from stub nodes when using transit-stub networks. The file (ts2ns.c) is included in sgb2ns distribution.
* Conversion of GT-ITM output to ns-2 hierarchical format
Download Padma Haldar's hierarchical converter package; it's included the sgb2ns distribution above. The package consists of sgb2hierns.c (the converter file) and example files t1000-0.gb (sgb file for 1000 nodes transit-stub) and hts1000.tcl (hierarchical topology converted from t1000-0.gb).
sgb2hierns converts the sgb output to a hierarchical topology in a tcl format suitable for ns-2.
Usage : sgb2hierns ts1000-0.gb hts1000.tcl
In order to use the scenario generator you would need the revised sgb2comns, which is also included in the sgb2ns distribution.
Tags : ns2 network simulator topology generator gt-itm
1 comment:
Hi
I hope to get your help to build a MC-CDMA simulator using ns-2 , and monitor the performance at various types of TCP on this simulator.
Iam already installed ns-2 in my computer and I try to implement some simple examples.
Regards
Post a Comment